Bitcoin dominance is a key metric in crypto markets, expressing Bitcoin’s market capitalization as a percentage of the total crypto market. It gauges Bitcoin’s share of total market cap and serves as a sentiment indicator. Rising BTC dominance often signals a risk-off market (capital flowing into Bitcoin as a “safe haven”), while falling dominance suggests risk-on sentiment and altcoin rallies. Over time, BTC dominance has shifted dramatically – for example, dropping from ~85% to ~40% in 2017 and again in 2021 during major altcoin booms. Investors use Bitcoin dominance to inform portfolio allocation (shifting between BTC and altcoins) and to anticipate market phases. This post explains how Bitcoin dominance is defined and calculated, reviews its historical trends (with a timeline), examines real market examples linking dominance to price moves and altcycles, and outlines practical implications for investors.
What is Bitcoin Dominance?
Bitcoin dominance (often denoted BTC.D) is the percentage of the total cryptocurrency market’s value that is tied up in Bitcoin. In other words, it’s Bitcoin’s market cap divided by the market cap of all cryptocurrencies. If Bitcoin’s market cap is $600 billion and the total crypto market cap is $1 trillion, BTC dominance is 60%. Since Bitcoin was the first and largest crypto, this metric has been widely followed as a market share gauge.
- A higher BTC dominance means Bitcoin accounts for a larger slice of the crypto market. This often happens when investors favor stability, as Bitcoin has high liquidity and is seen as less risky.
- A lower BTC dominance indicates altcoins (Ethereum, Solana, etc.) are capturing more market value. It typically occurs during altcoin seasons, when traders pour capital into smaller coins seeking higher returns.
Bitcoin dominance is calculated simply as:
BTC Dominance (%) = [(Bitcoin Market Cap)/(Total Crypto Market Cap)] * 100
For example, Glassnode (an on-chain analytics provider) explains: “BTC Dominance…denotes Bitcoin’s market cap as a percentage of the total market cap of all cryptocurrencies. It’s calculated by dividing Bitcoin’s market cap by the total crypto market cap”.
Different providers may include or exclude certain assets. CoinMarketCap counts stablecoins and tokens as part of “cryptoassets,” whereas some traders also track a “BTC dominance excluding stablecoins” metric. In practice, all sources use market cap (price × circulating supply) for BTC and total market cap in their ratio, with minor differences in which coins are included.
Calculation Methods and Data Sources
Bitcoin dominance is updated in real time by multiple platforms. Key differences lie in data coverage and frequency:
| Data Source | Included Assets | Calculation | Update Frequency | Notes |
|---|---|---|---|---|
| CoinMarketCap (CMC) | All cryptoassets (coins + tokens + stablecoins) | (BTC market cap / total crypto market cap)×100 | Real-time (API updates) | Includes stablecoins; widely cited metric |
| CoinGecko | All tracked cryptos (incl. stablecoins) | Same formula | Near real-time | Also offers BTC dominance chart |
| Glassnode Studio | All cryptocurrencies (BTC + altcoins + stablecoins) | Same formula | Updated daily (10:15 UTC) | On-chain analytic provider |
| TradingView (BTC.D) | Top ~125 coins by market cap (excludes small tokens) | Varies (usually the same ratio) | Real-time (exchange data) | Excludes many smaller tokens; stablecoins included among top coins |
| Other (Messari, etc.) | Varies | Varies (usually same ratio) | Varies | Some may provide analytics on BTC/alt flows |
Each source confirms the core formula, but discrepancies arise from scope. For example, TradingView’s BTC.D uses only the top 125 assets. Glassnode’s chart (above) indicates that metrics are refreshed daily, giving the previous day’s value.
Historical Trends and Notable Shifts
Bitcoin dominance has swung widely since crypto’s early days. In 2013, Bitcoin dominated roughly 94% of crypto value (few altcoins existed). The metric began to fall as new projects emerged. Major turning points include:
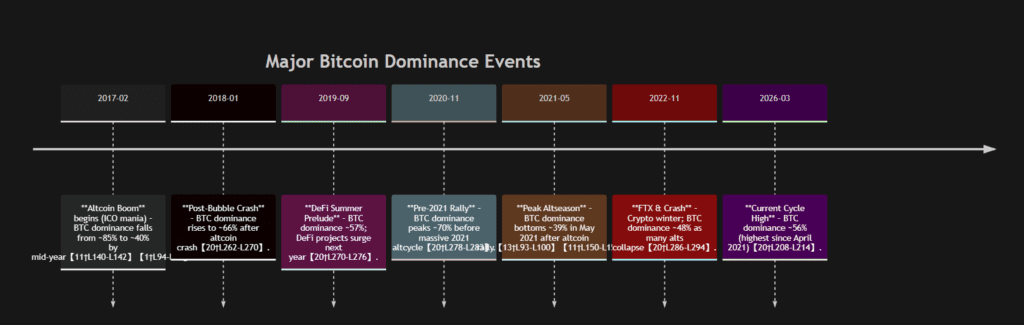
Each event had a profound market impact. For instance, Feb–Jun 2017 saw the ICO craze: Bitcoin dominance plunged from about 85% to 38% as thousands of new tokens launched. Conversely, when the bubble popped in late 2017 and early 2018, dominance shot back above 65% as many altcoins crashed. A similar pattern repeated in 2020–2021: by Nov 2020 BTC dominance hit ~70% (as Bitcoin surged to new highs), then fell to ~39% by May 2021 during a frenzied altcoin boom. A compact timeline is provided above, and key events are summarized in the table below.
| Date / Period | Event | BTC Dominance | Impact / Outcome |
|---|---|---|---|
| Early 2017 | ICO / Altcoin boom begins | ~85% → 40% | Massive investment flows into altcoins; ETH, XRP surge |
| Jan 2018 | Crypto bubble bursts | ~66% | Altcoins crash; many ICOs fail |
| Sep 2019 | DeFi Summer prep | ~57% | Growth in DeFi/Ethereum leads into 2020 alt rally |
| Nov 2020 | Pre-2021 Bitcoin rally | ~70% | Bitcoin strong; dominance peaks before altseason |
| May 2021 | Peak of 2021 altcoin season | ~39% | Altcoins outperform massively; dominance at a multi-year low |
| Nov 2022 | Crypto winter (FTX collapse) | ~48% | Many alts wiped out; BTC dominance rises as Bitcoin falls less |
| Mar 2026 | Current market outlook (resurgent BTC) | ~56% | Highest since 2021; suggests possible upcoming alt rotation |
Mermaid Timeline: The chart above visualizes these shifts chronologically. Notice the pattern: BTC dominance tends to spike during market stress (2018, 2020 crashes, 2022 winter) and drops sharply during altcoin bull runs (2017, 2021). Analysts often watch for peaks in dominance as precursors to the next alt season.
Empirical Evidence: BTC Dominance and Market Behavior
Empirical market cycles reinforce that Bitcoin dominance correlates with altcoin performance and sentiment:
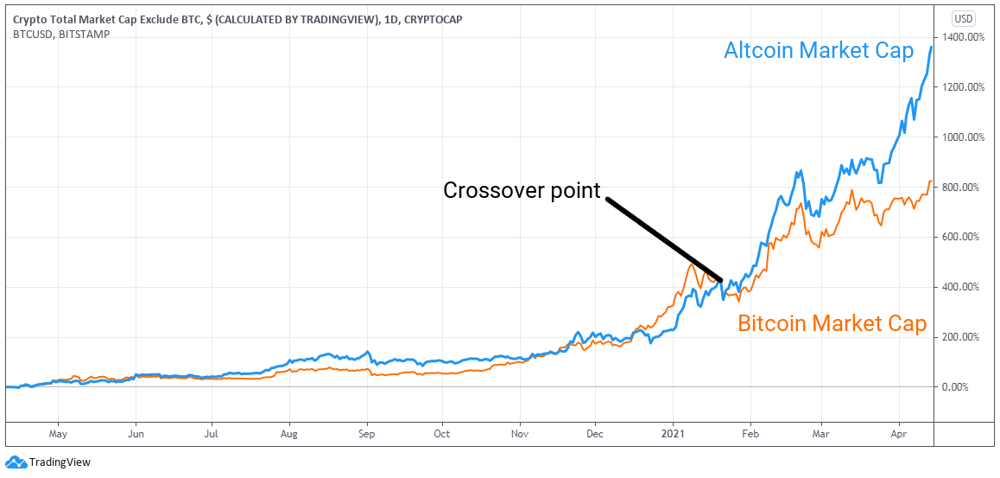
- Altcoin Seasons (Dominance Falls): When Bitcoin dominance falls sharply, altcoins typically rally. In early 2017, BTC dominance plummeted from 86.5% to ~38% by June as Ethereum (ETH) skyrocketed (its cap went from 5.9% to 31% of the market) and Ripple (XRP) surged. Likewise, in 2021, Bitcoin’s dominance bottomed around 39% while altcoins hit all-time highs – the total altcoin market cap briefly exceeded $1 trillion. The chart below illustrates one such episode:
- Bitcoin Price Moves: Rising BTC dominance often coincides with Bitcoin outperforming alts or declining less. For example, in the late-2025 correction mentioned by Phemex, Bitcoin fell from $126K to $67K, but altcoins fell much harder (Ether down 50%, other alt mids down 70–80%), so dominance climbed despite BTC price drop. This shows that rising dominance can signal the relative strength of Bitcoin even in a downturn.
- Risk-On/Risk-Off: Observers interpret high BTC dominance as a “flight to safety” within crypto. When global or stock market sentiment is bearish, or crypto-specific fear is high, investors may sell volatile small-cap tokens and consolidate into Bitcoin. By contrast, low dominance reflects confidence and risk appetite (investors chasing gains in alts).
- Consistent Cycles: Historically, every major altcoin rally of the past 5–6 years was preceded by a peak in BTC dominance, then followed by a decline. For instance, dominance peaked around 70% in Nov 2020; about 2–3 months later (Jan–May 2021), the 2021 alt season was in full swing. Phemex summarizes this: “Every altcoin holder wants to know if 56% marks the top of this dominance run… History offers a framework… every major altcoin rotation of the past six years.”. Their table of “Dominance Peaks” (see Bitcoin Dominance Peak section) shows peaks in early 2018 (~66%), Sept 2019 (57%), Nov 2020 (70%), and Nov 2022 (48%) – each followed by months-long alt rallies.
These examples highlight that BTC dominance can be a useful barometer of the market phase. However, it is not infallible – it should be combined with price charts, volume, and other indicators. As Gemini notes, rising dominance “may suggest investors are playing it safe,” while falling dominance “could be signaling optimism” and the start of altcoin cycles.
Practical Implications for Investors
Bitcoin dominance has several practical uses for cryptocurrency portfolio management and market analysis:
- Asset Allocation: Investors can use dominance trends to adjust allocation between Bitcoin and altcoins. When BTC dominance is high (market is risk-off), conservative strategies suggest holding more Bitcoin or stablecoins. When dominance falls and altcoin season begins, overweighting quality altcoins may yield higher returns. For example, traders sometimes use threshold levels (e.g., 50–60%) to time shifts: dominance dropping below 50% historically signaled a broad altseason.
- Hedging and Timing: Sudden swings in dominance often coincide with market reversals. A spike in BTC dominance (with BTC price rising) might indicate a late-stage Bitcoin rally or a bull market resurgence – a cue to potentially take profits on alts and re-balance towards BTC. Conversely, a sharp drop in dominance after a long BTC uptrend could warn of an incoming altcoin frenzy. By watching dominance along with BTC price (the four quadrants of dominance vs price in some trading frameworks), investors can gauge whether money is rotating into or out of altcoins.
- Indicators to Watch:
- Stablecoin Ratio: Since stablecoins (USDT, USDC) now hold ~10–15% of crypto market cap, some analysts track stablecoin dominance or flows (e.g., shifts from USD stablecoins into risk assets) as a complementary indicator. A decline in stablecoin dominance often precedes risk-on moves.
- Altcoin Season Index: Tools like CoinMarketCap’s Altcoin Season Index or BitGet’s chart often use thresholds of BTC dominance to signal alt seasons. For example, some analysts say a confirmed altseason occurs when BTC dominance falls below ~54%.
- Ethereum vs. Bitcoin: As Gemini notes, Ethereum’s growth has made ETH.D (Ethereum dominance) another factor. A combined view (like “BTC.D + ETH.D vs stablecoins”) can filter noise.
- On-chain Metrics: Advanced traders may use on-chain data (e.g., Bitcoin vs altcoin exchange flows or whale accumulation patterns) to refine insights on dominance changes.
- Portfolio Strategy: Dominance is one of many inputs. It does not replace fundamental research. Analysts caution not to “put all your eggs in one basket” based on dominance alone. Instead, use it alongside market cap trends, technical analysis, and macro factors. For instance, if BTC dominance is falling but BTC price is also falling (an unusual “BTC falling faster than alts” scenario), it may indicate market confusion (perhaps a Bitcoin-specific event) and suggest caution.
In summary, prudent investors monitor Bitcoin dominance to understand market sentiment and potential rotations. High dominance often aligns with market stress or Bitcoin bull trends; low dominance typically accompanies exuberant altcoin gains. Adjusting exposure accordingly – without ignoring other signals – can help in risk management and identifying opportunities.
I am Pawan Kashyap currently living in Amritsar. I always try to grab new things from the cryptocurrency market. From my observations and trends in the market, I always try to provide the best and accurate information in the form of articles from this blog. Follow us on Facebook, Instagram, and Twitter to join us.